- RollUpEurope
- Posts
- Why Private Equity can’t kick its UK Wealth obsession
Why Private Equity can’t kick its UK Wealth obsession
40+ consolidators can't be wrong, can they?
Alex Prokofjev
May 02, 2024

You do not need to be an investment banker to fall for the UK wealth management industry.
It is a trillion-dollar market characterised by:
Fee-based and asset-light revenue streams
Attractive unit economics enhanced by vertical integration
A high degree of fragmentation among the Independent Financial Advisor (IFA) community
Since 2017, scores of (mostly) mid market private equity firms swallowed a huge number of advisory firms across the nation. In 2023 alone, they completed 115 acquisitions. Some IFA rollups are onto their 3rd PE owner. Tailwinds aplenty: surging coupon payments, volatile asset-based fees, unrelenting regulatory onslaught. Still, not one of these aggregators has imploded. But nor have there been spectacular exits.
According to Citywire, in 2023 the 36 PE backed aggregators controlled 11% of total financial adviser population and 22% of managed assets. The true number is over 40 once we factor in smaller, family office backed investment vehicles.
As far as land grabs go, this one’s more like Principality of Sealand and less like the 1066 Norman Invasion it was supposed to resemble.

Many of these aggregators were funded by mid market US private equity firms. A key attraction for them was the valuation gap relative to US IRAs. However, as they since discovered, the arbitrage opportunity was not risk-free as it reflected numerous regulatory and operating risks. Which are now in plain sight.
Why is that and where is the industry headed? Should we expect a second wave of consolidation? And why is PE so obsessed with British IFAs?
Read on!
Let’s size up the market
Measured by the affluent individuals’ onshore liquid assets, the UK ranks in Top 5 globally. At the end of 2022, this represented an investable asset base of close to £4 trillion, or $5 trillion (sources: GlobalData, St James’ Place).
According to the consulting firm LEK, of this figure about half resides in “personal liquid investable financial assets”. The other half is in defined benefit pensions.
Of the £2 trillion addressable market, 60% or £1.2 trillion is advised. The remaining 40% is accounted for execution-only platforms like AJ Bell and Hargreaves Lansdown, defined contribution pensions etc.
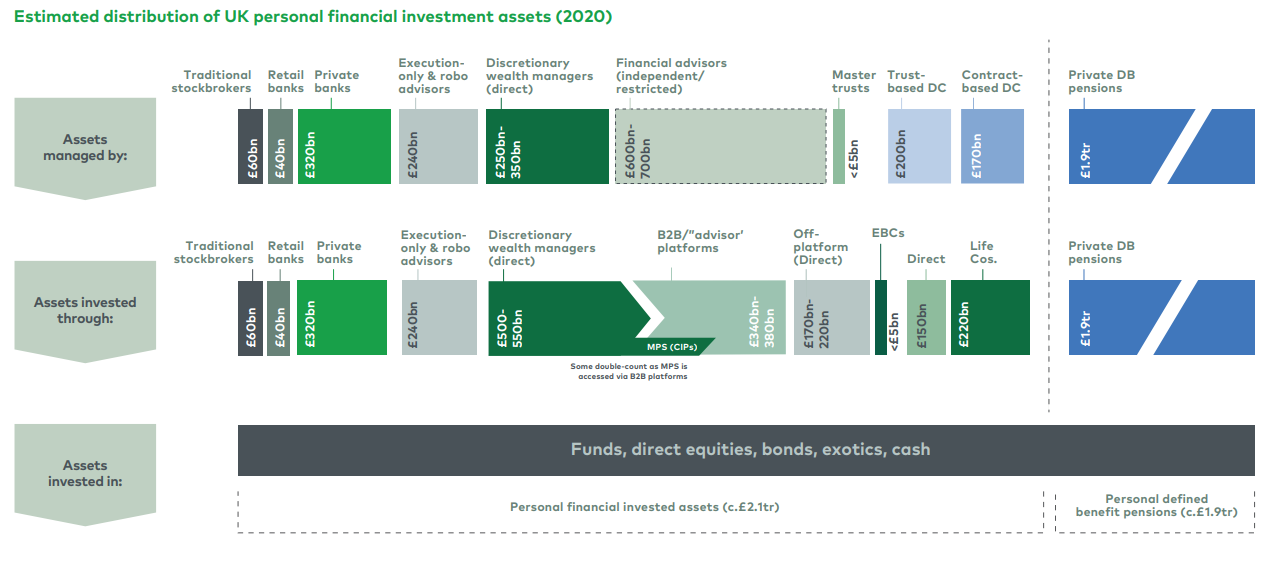
Source: LEK Consulting
The UK’s top 4 wealth managers hold a combined market share of 1/3.
The market leader St James’ Place (SJP) manages £168B in assets (based on December 2023 data), followed by Rahtbones with £105B AuM. In third place is the Canadian RBC with £60B+ AuM. Finally, in the 4th place we find Evelyn Partners, the largest PE backed firm with £59B AuM.
Each of Rathbones, RBC and Evelyn owe their scale largely to M&A:
Rathbones nearly doubled in size in 2023 after swallowing Investec’s UK Wealth & Investments business
In 2022, RBC took private Brewin & Dolphin
Evelyn was formed in 2020 following the merger of Tilney and Smith & Williamson, owned by Permira and Warburg Pincus, respectively
The regulations that got PE all excited
Over the last decade, the industry has been buffeted by a number of adverse developments: from Brexit to tax changes to various regulatory initiatives. The Retail Distribution Review, or RDR, profoundly changed the market when it came in force in January 2013.
The RDR’s three biggest initiatives were:
The ban on retrocessions from fund managers to advisers
“Raising the bar” on professional standards,
The requirement for advisers to disclose to customers whether they provided Independent Financial Advice or Restricted advice (i.e. marketing in-house funds)
The RDR had several major consequences:
Total adviser population decreased
An “advice gap” has emerged in the mass affluent segment
Advisory fees became mainstream
And most importantly: Private Equity descended on the UK in the hope of a bargain!
40+ consolidators can’t be wrong!
AuM/A rankings give a misleading perception about market structure since adviser population remains heavily skewed towards small firms. According to the UK Financial Conduct Authority, there are c.5,000 IFA firms that employ c.28,000 advisers (wealth managers, banks etc. employ c.9,000 advisers - bringing the total to 37,000).
As the chart below shows, the number of financial advisers had collapsed in the wake of the global financial crisis, then dropped some more post RDR, and has been slowly growing in recent years.
This is the outcome of larger firms pursuing M&A, as evidenced from the decline in total firm count.

Source: Barclays, Financial Conduct Authority
At the same time:
A staggering 47% of all IFA firms are effectively sole traders
Another 41% of all firms have between 2 and 5 advisers
In other words, there are thousands of advisers who had left banks / insurers 10 years ago to set up shop. Many are now into their 50s and 60s and look forward to retiring. There is deal flow for years to come.
At the opposite end of the spectrum you will find firms with 50+ advisers. Combined, such firms control nearly half of the total adviser population. This is deep PE territory: the 36 consolidators compiled by Citywire control over 30% of the segment’s adviser count. With that said, out of top 10 consolidators listed below (measured by the number of advisers) only 2 are actively acquiring. The rest have pulled back M&A to focus on integration and value creation for their sprawling portfolios.

Source: Citywire
What does the consolidator value creation playbook look like?
It’s three things:
Multiple arbitrage
Increasing yield on client assets through vertical integration
Cost synergies
Let’s dissect each one.